This edition of the Eye on Employment follows Niagara’s transition into stage 3 of pandemic recovery. As such, NWPB has attempted to offer as much context as possible on Niagara’s changing employment patterns. All of our insights and efforts to support Niagara during these times can be found through our COVID-19 portal.
Across Canada, July of 2020 saw an additional 291,800 (seasonally unadjusted) employed individuals compared to June of 2020. July is the third consecutive month to see national employment gains since the beginning of the pandemic. It remains important to understand that changes in employment do not directly correlate to job creation. Data from the Labour Force Survey measures employment changes within the workforce, itself. The extent to which COVID-19 created job losses or gains, be they temporary or permanent, cannot be determined from this data.
Niagara enjoyed some increases in employment between June and July of 2020. July’s data report 6,900 individuals gaining employment in Niagara. However, the region remains heavily impacted by the COVID-19 pandemic. Ongoing support for employers and job seekers amid the pandemic can be accessed through Niagara’s Employment Ontario network. Please click this link for a list of Niagara’s employment service providers.
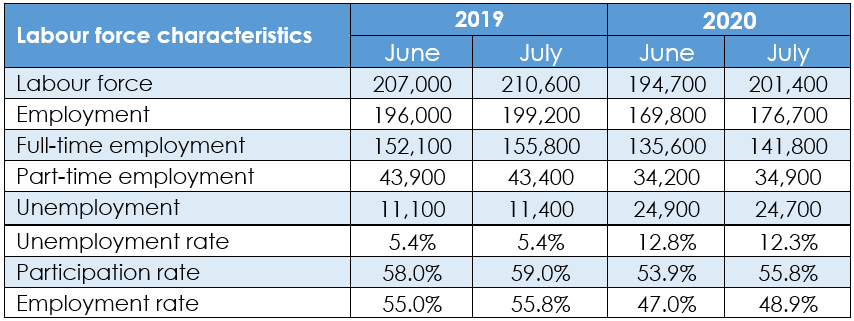
Table 1: Niagara – Current and Historical Trends – Seasonally Unadjusted
A note on our data source: Statistics Canada uses a three-month floating average to produce its monthly data at a regional level. This process typically controls for the volatility inherent to small sample sizes. Ideally, it ensures that an anomaly in a single employment sector in a single month does not have a disproportionate impact on all regional data.
With respect to July’s data, we can expect that employment trends from May and June’s data will have an impact on the current figures. Nonetheless, these data remain the best indicator of local employment trends and a firm foundation for future analysis and benchmarking.
Month-over-month data show that 6,900 more people were working in July of 2020 compared to June of 2020. At the same time, there were 200 fewer unemployed people in Niagara. These changes account for decreases in Niagara’s unemployment rate (12.3% in July down from 12.8% in June) and increases in both the participation rate (55.8% in July up from 53.9% in June) and the employment rate (48.9% in July up from 47.0% in June).
Despite the positive month-over-month indicators, comparing July 2019 to July 2020 demonstrates the impact of COVID-19 on the local labour force. Compared to this time last year, July of 2020 saw 22,500 fewer people in employment – 14,000 of those individuals were in full-time work and 8,500 were in part-time work. Similarly, there were 13,300 more unemployed people in July of 2020 compared to July of 2019.
While the month-over-month employment gains are encouraging, it must be noted that these gains were not evenly distributed within Niagara’s workforce. Individuals aged 55 to 64 saw the largest employment gains between June and July of 2020. Therein, July saw 2,700 people aged 55 to 64 entering employment compared to 2,300 people aged 25 to 54.
Additionally, there was a marked imbalance in employment gains along gender lines. Where 5,700 men found employment in July of 2020, only 1,300 women found employment during the same month. In other words for every 1 woman who entered employment in July, 4.3 men found employment. Part of this imbalance is seen in the fact that approximately 62.3% of employment gains in Niagara were found in the manufacturing and construction industries – industries which historically have employed more men than women.
It is important to keep in mind that the data in Table 1 are seasonally unadjusted figures. That means factors such as holidays, seasonality inherent to a given industry, and other factors that can be reasonably predicted to influence employment are not accounted for in these data. Seasonally adjusted data show that there were 4,700 more people employed in Niagara between June of 2020 and July of 2020. This is similar, thought slightly smaller in scale, to the seasonally unadjusted data – which showed an employment gain of 6,900 people. These data demonstrate that when we control for expected seasonal gains that are historically associated with Niagara’s warm weather economy, we see a slight seasonal boost in employment.
The Youth Lens
Labour Force Survey data also allow us a snapshot of youth (defined as people age 15 to 24) employment in Niagara. Once again these data do not account for seasonality.
Table 2: Niagara – Current and Historical Trends – Youth Age 15 to 24 – Seasonally Unadjusted
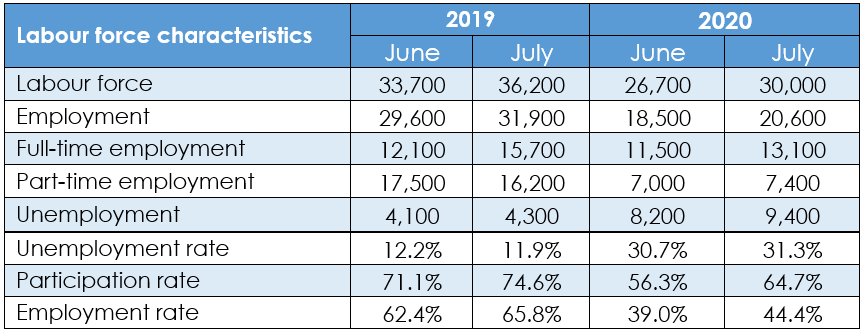
Statistics Canada reports 2,100 more youth working in July of 2020 compared to June of 2020. July of 2020 further saw 1,600 more youth working in a full-time capacity and 400 more youth working in a part-time capacity.
July of 2020 saw an increase in the youth unemployment rate (31.3% in July of 2020 up from 30.7% in June of 2020). A month-over-month increase in the youth participation rate (64.7% in July of 2020 up from 56.3% in June of 2020) and an increase in the youth employment rate (44.4% in July of 2020 up from 39.0% in June) suggests that youth are trying to actively engage in the labour force. Specifically, gains in the employment rate occurring in tandem with increases in youth unemployment and youth labour market participation suggest youth are entering the labour force. However these data suggest youth are also experiencing challenges in securing employment while jobseeking.
Sectoral Shifts
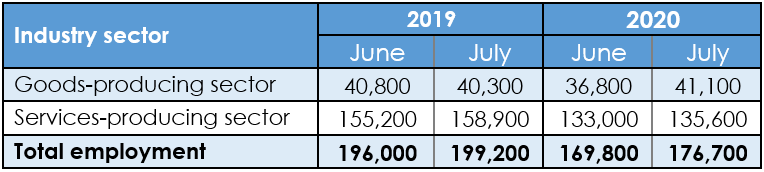
Table 3 offers additional insight into the changing employment patterns within Niagara’s major industry sectors. These data reflect month-over-month employment gains for both the goods- and services-producing sectors in Niagara. July of 2020 saw an additional 4,300 people in employment in the goods-producing sector, and an additional 2,600 people in employment in the services producing sector. While these figures are still well below those that were observed in June and July of 2019, they reflect the second month of total employment growth in Niagara since the start of the pandemic.
Table 3: Niagara – Employment Sectors – Monthly and Annual Data
Recognizing that monthly industry data from the Labour Force Survey can be volatile and prone to shifts, the July 2020 data show a range of employment gains and losses across multiple sectors.
Table 4: Niagara – Detailed Employment Sectors – Monthly and Annual Data
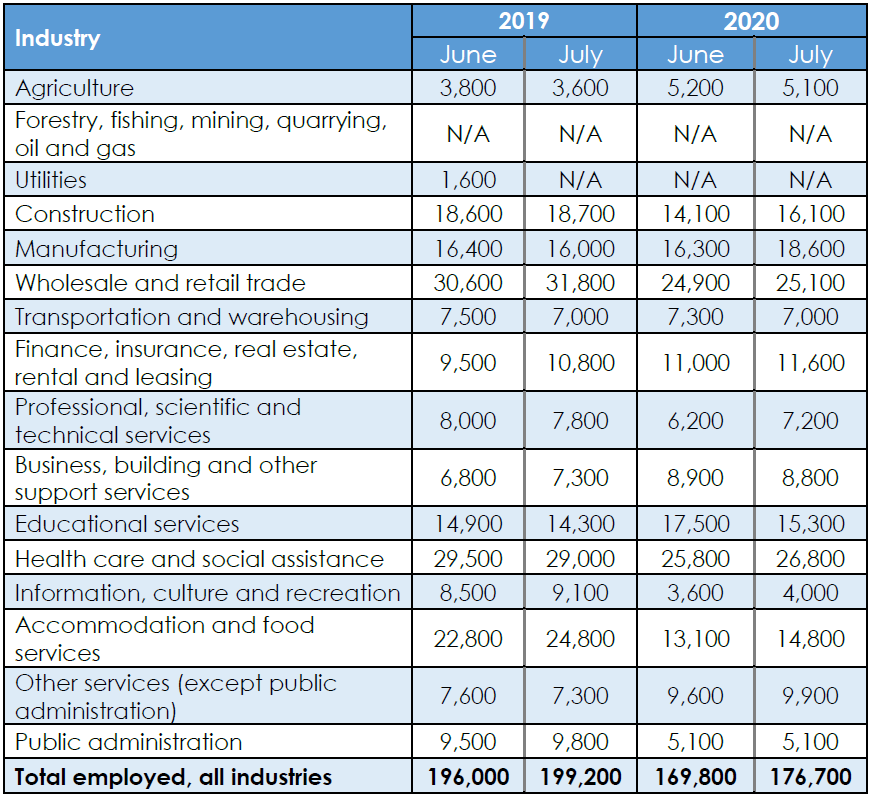
Within the goods-producing industries, month-over-month data show 2,000 more people employed in construction in July of 2020 and 2,300 more people employed in manufacturing. Once again, the historic concentration of men working in these industries likely accounts for Niagara’s disproportionate employment gains for men compared to women. The services-producing sector saw some notable increases, with an additional 1,700 people employed in accommodation and food services between June and July of 2020. Despite Niagara entering Stage 3 of recovery on July 24, 2020, the wholesale and retail trade sector reported an employment increase of only 200 people. It is likely that the employment impacts of Stage 3 did not present themselves in time to be captured during the data collection window for the Labour Force Survey (collected July 12-18).
Niagara’s transportation and warehousing and educational services sectors show notable month-over-month employment declines. July of 2020 saw 300 fewer people employed in transportation and warehousing compared to June of 2020, though the number of individuals reporting employment in this sector is identical to the figure reported in July of 2019. Educational services saw 2,200 fewer people employed in July of 2020 compared to the previous month. However, employment in this industry is higher than this time last year where we saw 14,300 individuals reporting employment compared to 15,300 in July of 2020.
We now offer the Eye on Employment in a downloadable PDF format. You can download the PDF by clicking this link.
Would you like to know more? NWPB is ready for your questions. Reach out to NWPB’s CEO, Vivian Kinnaird.