This edition of the Eye on Employment is released as Niagara moves from the green (“prevent”) to yellow (“protect”) level under Ontario’s new system for pandemic recovery. During these times, NWPB has attempted to offer as much context as possible on Niagara’s changing employment patterns. All of our insights and efforts to support Niagara during these times can be found through our COVID-19 portal.
Across Canada, October 2020 saw an additional 72,400 (seasonally unadjusted) employed individuals compared to September 2020. October is the sixth consecutive month to see national employment gains since the beginning of the pandemic.
It remains important to understand that changes in employment do not directly correlate to job creation, particularly at a local level. Data from the Labour Force Survey measures employment changes within the workforce, itself. The extent to which COVID-19 created job losses or gains, be they temporary or permanent, cannot be determined from this data.
Niagara enjoyed increases in employment between September 2020 and October 2020, adding 6,300 people to the local employment count. Compared to this time last year, however, the current data show 6,200 fewer employed Niagara residents.
Ongoing support for employers and job seekers amid the pandemic can be accessed through Niagara’s Employment Ontario network. Please click this link for a list of Niagara’s employment service providers.
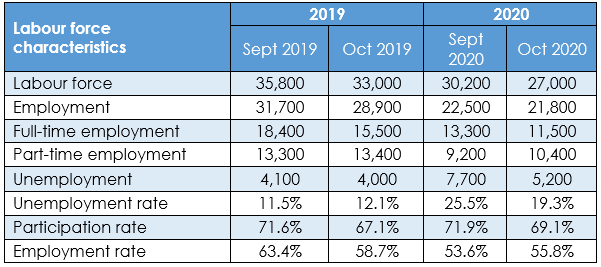
Table 1: Niagara – Current and Historical Trends – Seasonally Unadjusted

A note on our data source: Statistics Canada uses a three-month floating average to produce its monthly data at a regional level. This process typically controls for the volatility inherent to small sample sizes. Ideally, it ensures that an anomaly in a single employment sector in a single month does not have a disproportionate impact on all regional data. With respect to October’s data, we can expect that employment trends from August and September will have an impact on the current figures. Nonetheless, these data remain the best indicator of local employment trends and a firm foundation for future analysis and benchmarking.
Month-over-month data show that 6,300 more people were working in October 2020 compared to September 2020. At the same time, there were 3,100 fewer unemployed people in Niagara. However, all of these employment gains were in part-time work. Month-over-month, Niagara saw 800 fewer people working in a full-time capacity and 7,100 more working in a part-time capacity. This local trend occurred alongside similar changes at the provincial level; therein, Ontario saw 18,900 fewer people in full-time employment between September 2020 and October 2020, and 49,100 more people in part-time employment.
October’s key labour market indicators reflect a reduced unemployment rate of 7.2% (down from 8.8% in September 2020), an increased participation rate of 59.0% (up from 58.1% in September 2020), and an increased employment rate of 54.8% (up from 53.1% in September 2020). In a typical year, a trend of decreased unemployment occurring with increases in the employment and participation rate would reflect an ideal state of affairs. As Niagara continues to recover from COVID-19, these data show that we are progressing along a recovery trajectory. However, we have not yet reached a point of parity with our pre-COVID employment levels noted in February of 2020.
October of 2020 continued to see disparity in employment between men and women in Niagara (note: Statistics Canada’s labour force survey reports gender data between two variables: men and women. This limitation is beyond NWPB’s ability to control or correct.)
Although 4,900 of Niagara’s 6,300 employment gains in October 2020 were enjoyed by women, only 200 of those employment gains were for full-time employment. In October of 2019, women represented 44.4% of Niagara’s full-time workforce; in October of 2020, that percentage fell to 40.1%. This is one of the many ways in which COVID-19 has changed employment trends between men and women.
It is important to keep in mind that the data in Table 1 are seasonally unadjusted figures. That means factors such as holidays, seasonality inherent to a given industry, and other factors that can be reasonably predicted to influence employment are not accounted for in these data. Seasonally adjusted data show that there were 5,900 more people employed in Niagara between September 2020 and October 2020. This is similar in trend but lesser in scope when compared to the unadjusted data – which showed an employment gain of 6,300 people.
These data show how seasonality has increased employment gains in Niagara for the month of October 2020. The seasonal uncertainty that remains to be seen is how COVID-19 will impact seasonal hiring in November and December. NWPB will monitor these trends over the coming months. To gain some greater insights on the impact of COVID-19 on retail employers, we are welcoming one-on-one engagements and focus groups with local retailers. Those retail operators interested in participating should contact NWPB Project Manager, Thalia Semplonius.
The Youth Lens
Labour Force Survey data also allow us a snapshot of youth (defined as people age 15 to 24) employment in Niagara. Once again these data do not account for seasonality.
Table 2: Niagara – Current and Historical Trends – Youth Age 15 to 24 – Seasonally Unadjusted
Statistics Canada reports 700 fewer youth working in October 2020 compared to September 2020. Month-over-month, October 2020 reported 1,800 fewer youth working in a full-time capacity and 1,200 more youth working in a part-time capacity.
October’s key labour market indicators for youth report a reduced unemployment rate of 19.3% (down from 25.5% in September 2020), a decreased participation rate of 69.1% (down 71.9% in September 2020), and an increased employment rate of 55.8% (up from 53.6% in September 2020.
Historical trends tend to see more youth leaving the labour force in the early autumn months as youth return to education and training. However, October 2020’s data show considerable changes from October 2019; therein, current data reflect 7,100 fewer youth in employment compared to this time last year, and 1,200 more unemployed youth compared to this time last year.
Sectoral Shifts
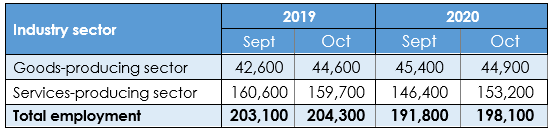
Table 3 offers additional insight into the changing employment patterns within Niagara’s major industry sectors. October 2020 saw 500 fewer people in employment in the goods-producing sector, and 6,800 more people in employment in the services-producing sector.
Table 3: Niagara – Employment Sectors – Monthly and Annual Data
Recognizing that monthly industry data from the Labour Force Survey can be volatile and prone to shifts, the October 2020 data show a range of employment gains and losses across multiple sectors.
Table 4: Niagara – Detailed Employment Sectors – Monthly Data
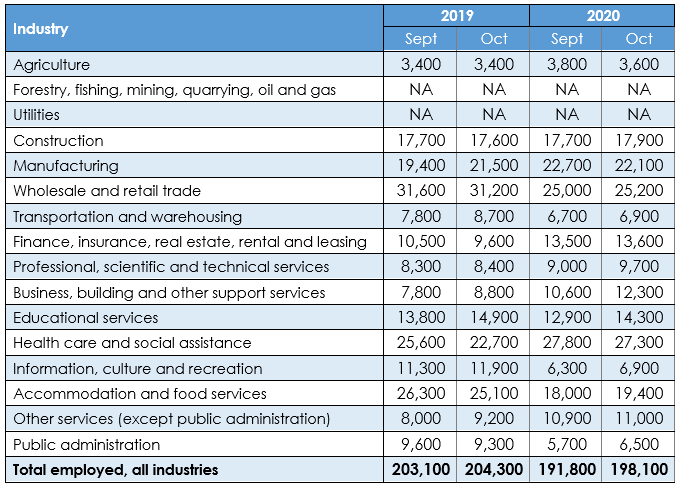
The largest services-producing sector gains were seen in business, building and other support services, which saw 1,700 more people in employment in October 2020 compared to September 2020. Employment in accommodations and food services and educational services both noted month-over-month gains of 1,400 people, respectively.
Would you like to know more? NWPB is ready for your questions. Reach out to NWPB’s CEO, Vivian Kinnaird.