Gender Equity Labour Force Series: Niagara’s Workforce and Areas of Employment

Home Gender EquityGender Equity Labour Force Series: Niagara’s Workforce and Areas of Employment

One of NWPB’s 2020-2021 projects is to produce a gender-focused Labour Market Report. Given the current context, taking into account the gendered impacts of COVID-19 offers a deeper understanding of specific local impacts. It also offers context for those working towards gender equity and aligns with current priorities of Niagara’s Regional government.

In addition to a larger report, we will be publishing a series of posts outlining gender-focused labour market information. This post will focus on providing a baseline understanding of who is living and working in Niagara.

Who is living and working in Niagara?

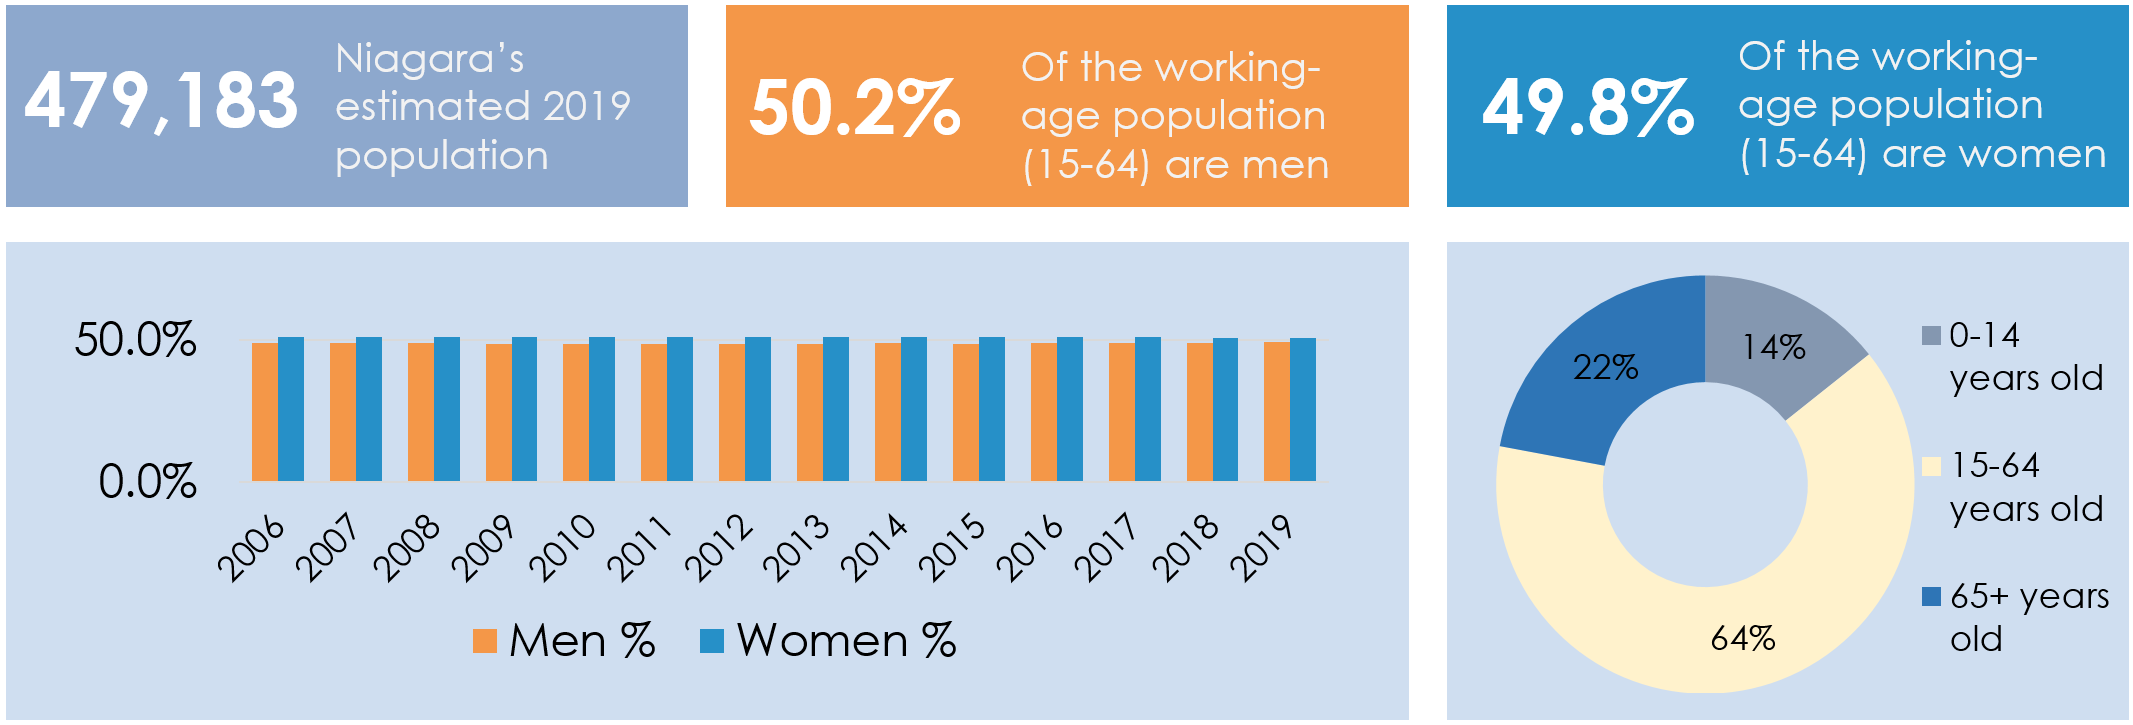
To gain insight on local employment, it is important to understand Niagara’s population. These data can be broken down by gender (note: Statistics Canada’s data reports gender between two variables: men and women. This limitation is beyond NWPB’s ability to control or correct).

Niagara has seen steady population growth, with the ratio of men and women remaining relatively stable over time.

Infographic showing the following data: Niagara's estimated population in 2019 was 479,183. Of that population, 50.2% of the working-age population (15-64) are men, and 49.8% are women. 64% of Niagara's population fall within the working-age range, while 14% of the population ranged between 0-14 years of age and 22% was over 65 years old.
Source: Statistics Canada. Table 17-10-0139-01 Population estimates, July 1, by census division, 2016 boundaries

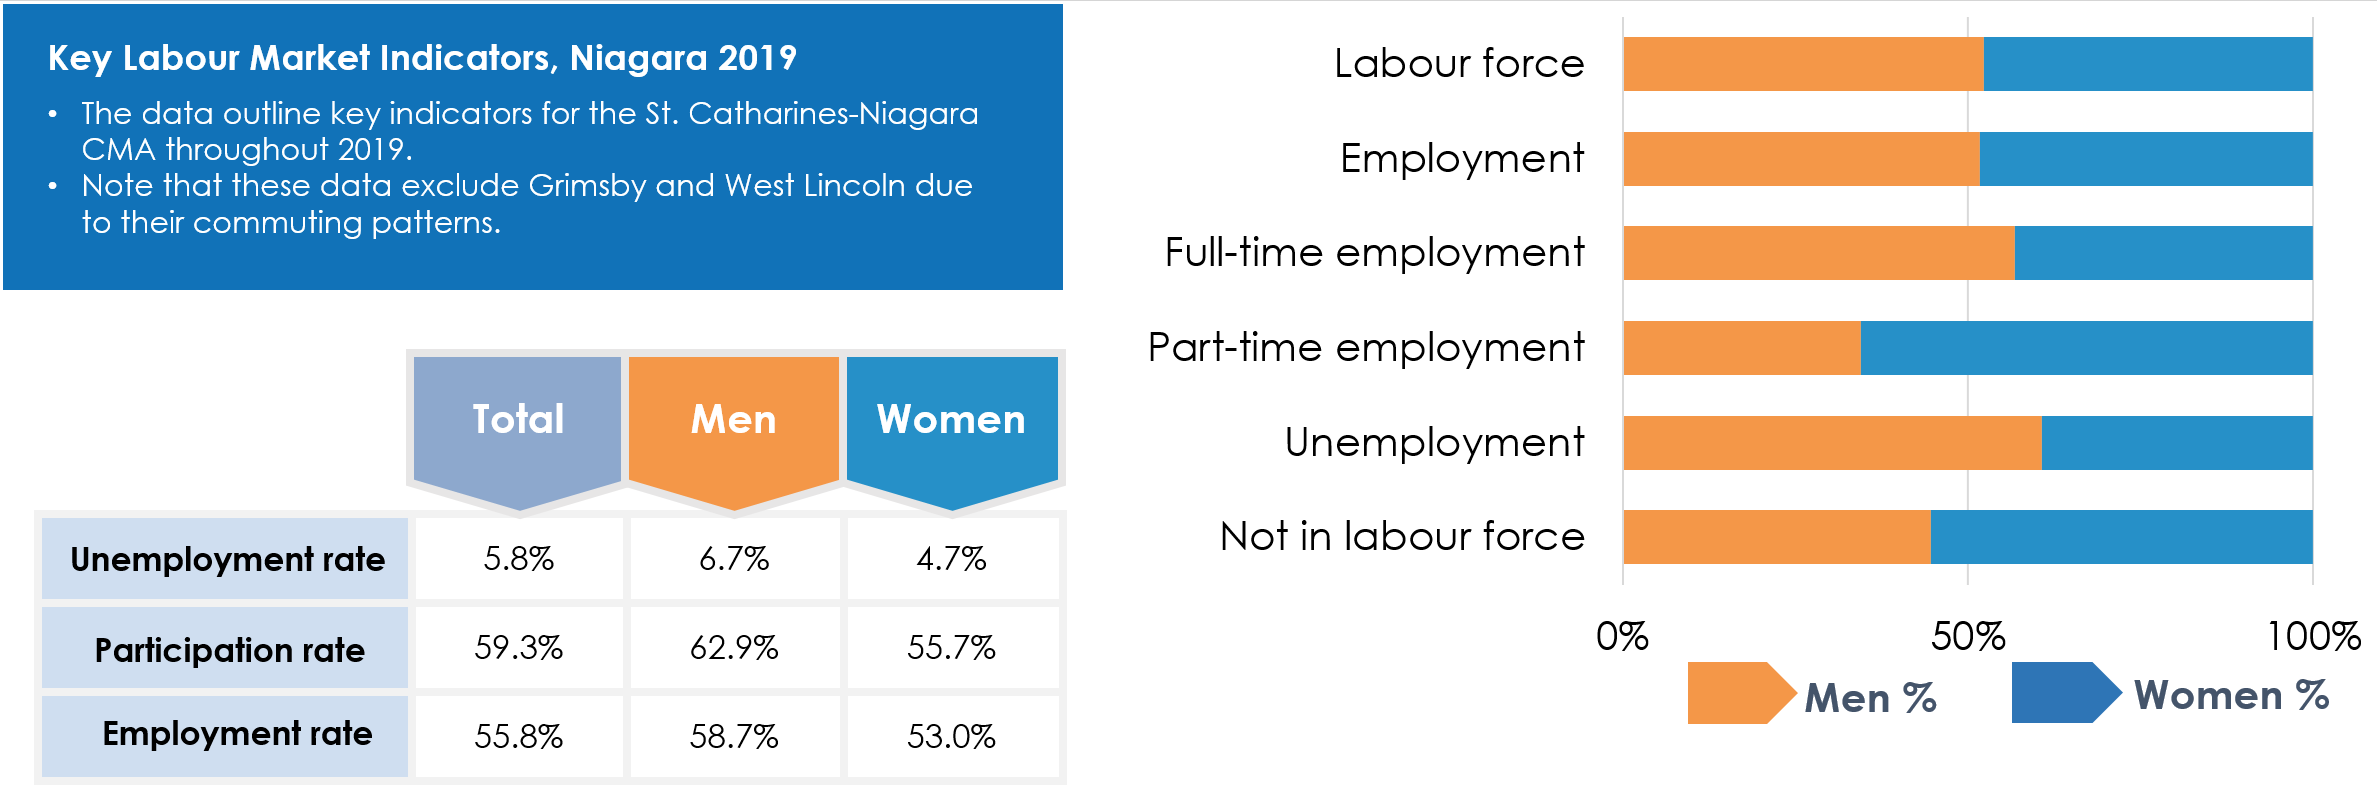
Specific information on Niagara’s labour force is available every month from Statistics Canada’s Labour Force Survey. Definitions on key labour force characteristics can be found here.

On the surface, Niagara’s local labour force and employed individuals had fairly equal representations of men and women. However, when we dive deeper into these indicators, we see a higher percentage of men than women in full-time employment. In contrast, we see a higher percentage of women than men in part-time employment.

Infographic showing the following data: In 2019, the unemployment rate in the St. Catharines-Niagara CMA was at 5.8% overall, 6.7% for men and 4.7% for women. The participation rate was 59.3% overall, with 62.9% of working-age men represented and 55.7% of working-age women. The employment rate totaled 55.8%, with 58.7% for men and 53.0% for women. The labour force and employment rate has fairly equal representation, with men showing greater representation in full-time employment and women more likely to be in part-time employment.
Source: Statistics Canada Labour Force Survey, Table: 14-10-0096-01 (formerly CANSIM 282-0129)

Here we see the top 5 occupations of employment for Niagara residents, and a provincial-level gender breakdown for those employed in these occupations. Census data provide 2015 income for men and women working full-time in these occupations.

Infographic showing the following data: The top 5 occupations of employment in Niagara, 2019, were sales & service; trades, transport & equipment operators; business, finance & administration; education, law & social, community & government services; and health. Men's median income tended to be between $10,000 and $30,000 more than women's median income within these fields, with the largest gap in education, law & social, community & government services. Women tend to represent the majority of those employed in these fields, with the exception of trades, transport & equipment operators & related work - over 90% of people working in this occupation are men. Women tend to be more represented in health at roughly 80%; education, law & social, community & government services and business, finance & administration at closer to 75%. In sales & service the numbers are closer to equal, with women representing roughly 60% of this workforce.
Sources: Table 14-10-0314-01 Employment by census metropolitan areas and occupation, annual (x 1,000). Statistics Canada. Table 14-10-0335-01 Labour force characteristics by occupation, annual. 2016 census, custom data tabulation

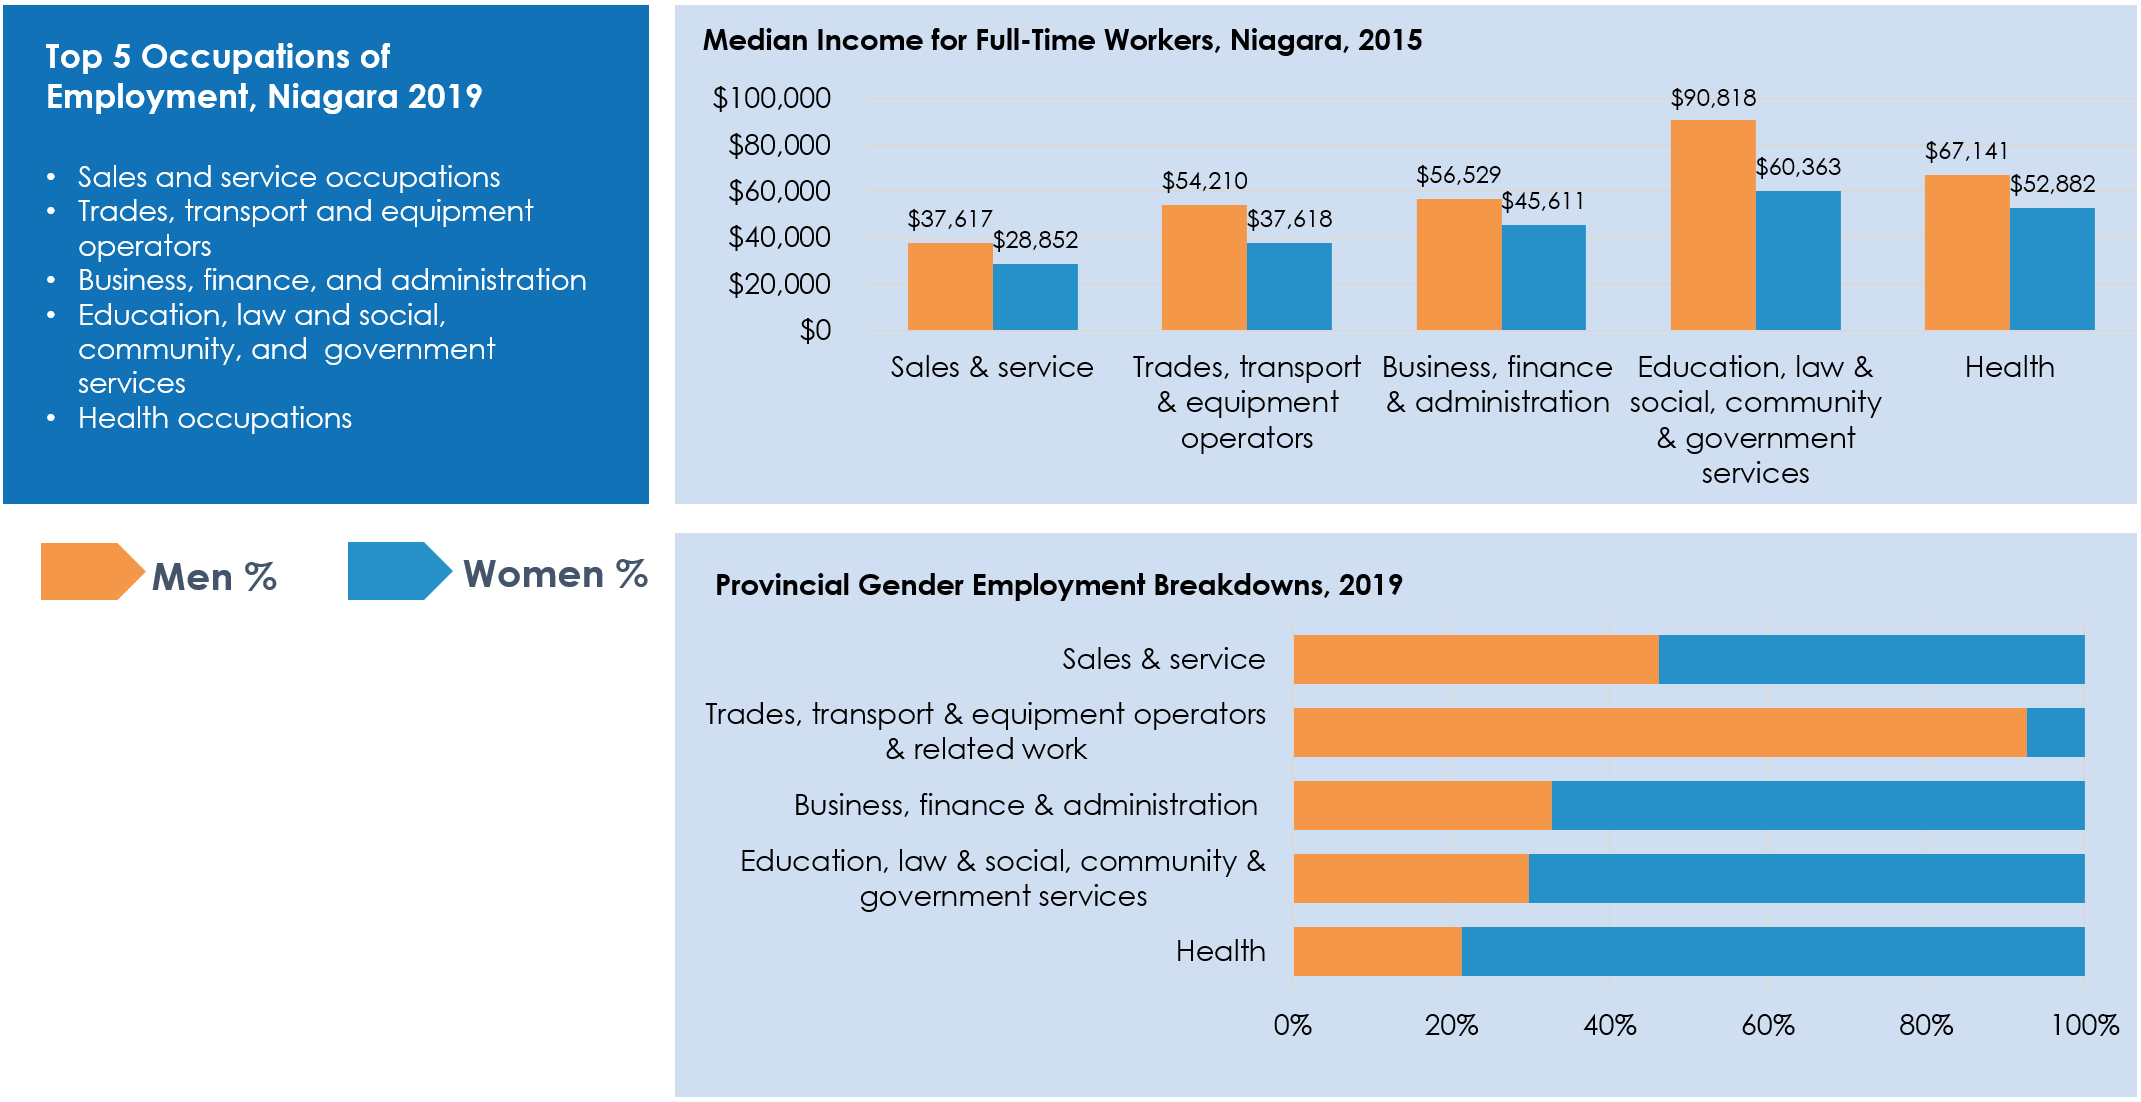
Overall, these data indicate that locally, men and women are fairly equally represented in the local labour force. However, there are differences in the occupations where men and women typically report employment.

As an example, we tend to see more men reporting employment in trades, transport and equipment operators and related occupations than women. Further, men reported higher median income in this occupation than women.

We also tend to see more women reporting employment in health occupations and occupations in education, law and social, community and government services. However, income data from 2015 indicate that women reported lower income than men in these same general occupations.


A full infographic of the above data can be downloaded here for your convenience.

Would you like to know more? NWPB is ready for your questions. Please reach out to NWPB’s CEO, Vivian Kinnaird.

Share
Copy Link

Help Us Serve You Better

We are collecting data to better understand who is looking for work and what kind of opportunities jobseekers are searching for. This data is completely anonymous and non-personally identifiable.

Your Age: